Article type: Analysis
Abstract. This paper proposes that the dominant global economic trajectory is not a failed attempt at a life-capacity objective but a coherent pursuit of a different one — LESS (Less for All Life). Using the same state space, floors, participants, and dynamics as the constructive framework MORE, we formulate LESS as the trajectory implied by a revealed objective in which unpriced life-capacity carries a shadow price near zero. We derive ten diagnostic principles, state seven falsifiable propositions, and test them on a ~7,800 country-year panel (1990–2020; World Bank WDI, Our World in Data). Results support the diagnosis: growth is associated with ecological-capacity decline (p<0.001, emissions-coupled); growth is decoupled from genuine progress (corr ≈ 0.003); floor violations are pervasive (52–69% of country-years) though declining; higher inequality predicts higher extraction prevalence (p≈0.03); a frontier-foreclosure proposition (L7) is supported at signature level only. The diagnosis implies a hard constraint on alternatives such as MORE: the revealed objective is locked in by the feasibility set of its beneficiaries, so replacing it requires changing who benefits — not merely proposing a better objective.
Keywords: life-capacity; revealed preference; planetary boundaries; GDP critique; inequality; falsifiability
A large literature now documents the distance between what economies measure and what they produce: GDP miscounts welfare (Stiglitz et al. 2010; Coyle 2014); growth has overshot planetary boundaries (Rockström et al. 2009; Steffen et al. 2015; Richardson et al. 2023; Potsdam Institute for Climate Impact Research 2025; Caesar et al. 2026; Stenzel et al. 2025); gains have pooled at the top of the distribution (Piketty 2014; Chancel et al. 2025). The standard reading of this record is diagnostic: the system is failing to deliver what it promises.
This paper proposes a different reading. The observed trajectory is not a malfunctioning version of a good objective; it is a functioning version of a different one. If we take revealed preference seriously — infer the objective from what the system repeatedly does rather than what it says — the dominant trajectory is well-described by a maximisation problem in which unpriced life-capacity enters with a shadow price near zero. On this reading, ecological degradation, distributional concentration, and measurement distortion are not anomalies to be explained; they are the signature of the objective actually being pursued.
We name this objective and its implied framework LESS — Less for All Life, in deliberate mirror of the constructive framework MORE — More for All Life — which proposes an economy whose objective is to increase the capacity of the whole living system within ecological and social floors. Where MORE is a proposal, LESS is a diagnosis: a formal characterisation of the trajectory that MORE must displace, specified in the same notation so that the two are commensurable.
The critique tradition — national-accounts criticism (Stiglitz et al. 2010; Coyle 2014), growth limits (Meadows et al. 1972), capital and distribution (Piketty 2014), degrowth and post-growth (Hickel 2020; Kallis 2018; Jackson 2017; Kallis et al. 2025) — has produced a large body of work. Yet a recent systematic review of 561 degrowth studies finds that nearly 90% are opinions rather than analyses, few use formal modelling, and most offer ad hoc policy advice without evaluation (Savin and Bergh 2024). The field documents that the trajectory is wrong far better than it specifies what objective the trajectory serves or what falsifiable signatures that objective should leave in data.
LESS attempts to supply that specification. The claim is not that the diagnosis is new in spirit — Marx, Polanyi, Georgescu-Roegen’s entropy economics (Georgescu-Roegen 1971), Meadows, and Piketty each described parts of it, and van den Bergh’s a-growth position anticipates treating the growth debate as secondary to objectives (Bergh 2011). The closest methodological precedent is Saez and Stantcheva’s generalised welfare weights, which infer distributional weights from observed tax systems rather than positing them (Saez and Stantcheva 2016); LESS extends the same revealed-preference logic from welfare weights over individuals to objective weights over capacity dimensions. System-level framings also exist: the polycrisis literature characterises entangled global crises (M. Lawrence et al. 2022), and repeated comparisons of the World3 model with subsequent data find the observed trajectory tracks growth-continuation scenarios (Turner 2008; Herrington 2021) — descriptive alignments, not objective identification. The claim is that formalising the trajectory as a revealed objective function with measurable state variables and falsifiable propositions makes it testable, comparable across eras and economies, and directly commensurable with constructive alternatives.
Section 2 states the revealed-objective conjecture. Section 3 gives ten diagnostic principles mirroring MORE’s ten design principles. Section 4 formalises the model on the same state space as MORE. Section 5 states seven falsifiable propositions. Section 6 reports the empirical tests on a 7,844 country-year panel plus signature-level evidence on the frontier/space dimension (§6.7). Section 7 maps the LESS↔︎MORE mirror exactly. Section 8 answers objections, including the implication LESS carries for alternatives such as MORE — and the strongest apparent counterexample, the private frontier economy. Section 9 gives implications; Section 10 limitations and research agenda — three of which (trajectory-operator estimation, θ>0 emergence conditions, formalised objective-switching) are taken up by the companion paper IS — How Objectives Switch. Appendices contain derivations, the exceed benchmark, and test protocols.
Economies are usually described by their stated objectives: growth with stability, shared prosperity, sustainable development. Revealed-preference logic asks a different question: given the policies actually implemented — the taxes not levied, the externalities not priced, the floors not enforced — what objective is consistent with the observed choices?
Three features of the observed trajectory constrain the inference:
A single parameterisation unifies these observations: the economy behaves as if solving a private-returns problem in which life-capacity depreciation — terrestrial and frontier alike — is present but weighted near zero.
Conjecture L0 (Revealed objective). The dominant global trajectory is consistent with maximisation of
where Π(t) is aggregate return accruing to the actor’s cared set — self, kin, and recognised others — rather than all private return indiscriminately, D(t) ≥ 0 is unpriced life-capacity depreciation (flow), ρ is a high effective discount rate relative to ecological recovery horizons, and θ is the effective shadow price of life-capacity in decisions. D(t) is not restricted to terrestrial stocks: depreciation of the frontier-capacity stock (orbital-commons degradation, foreclosed launch diversity, decayed long-horizon institutions) enters the same unpriced term. The diagnosis is that θ is not merely small but near zero — and, where floor violations themselves generate private returns, effectively negative. §6.6 reports a first-pass empirical bound (θ ≲ 0.2 in damage-weighted terms; regression signatures consistent with depreciation being a source of private return rather than a priced cost); the conjecture’s strong form (θ exactly 0) is not required — the diagnosis needs only θ far below what a life-capacity objective would imply. LESS is the proposition that the observed policy set is consistent with Φ and inconsistent with any objective placing substantial weight on D or on the least-capable subsystem.
The cared set. Φ is better described as circle-limited than as universal self-interest. The return term Π(t) aggregates benefits accruing to a cared set — the actor’s own life and the lives they recognise as counting — rather than all private return indiscriminately, and the effective shadow price θ is distance-dependent: near zero for depreciation borne by life outside the cared set, possibly substantial for depreciation borne within it. The refinement is empirically consequential: it predicts the signature pattern of internal protection with external extraction — strict domestic standards alongside outsourced extraction, conservation at home beside externalised costs abroad — and it grounds LESS’s ethical claim in the documented psychology of parochial altruism and moral exclusion (Bernhard et al. 2006; Opotow 1990; Singer 1981). Circle-limited Φ is the precise opposite of MORE’s universal Commitment: where MORE asks for more for all life, LESS’s revealed objective asks for more for the lives the actor counts — which is why the transition problem (IS) is, at bottom, a cared-set expansion problem.
Conjecture L0 is testable in principle: if θ were substantial, observed trajectories should show systematic avoidance of floor violations; if it were negative and large, violations should dominate all choices rather than most. §5 turns this into propositions and §6 tests their observable signatures.
Two common misunderstandings must be preempted. First, LESS is not a claim that output is bad: under Φ, output growth is precisely what is rewarded; the diagnosis is that it is rewarded while life-capacity is discounted at ≈0, so growth occurs through extraction where extraction is cheaper. Second, LESS is not a moral claim about intentions. No one needs to want less for all life; the objective emerges from the rules — what is priced, what is verified, who has standing, what is discounted. A system in which unpriced stocks enter decisions with weight zero will produce less for all life even if every participant sincerely endorses more.
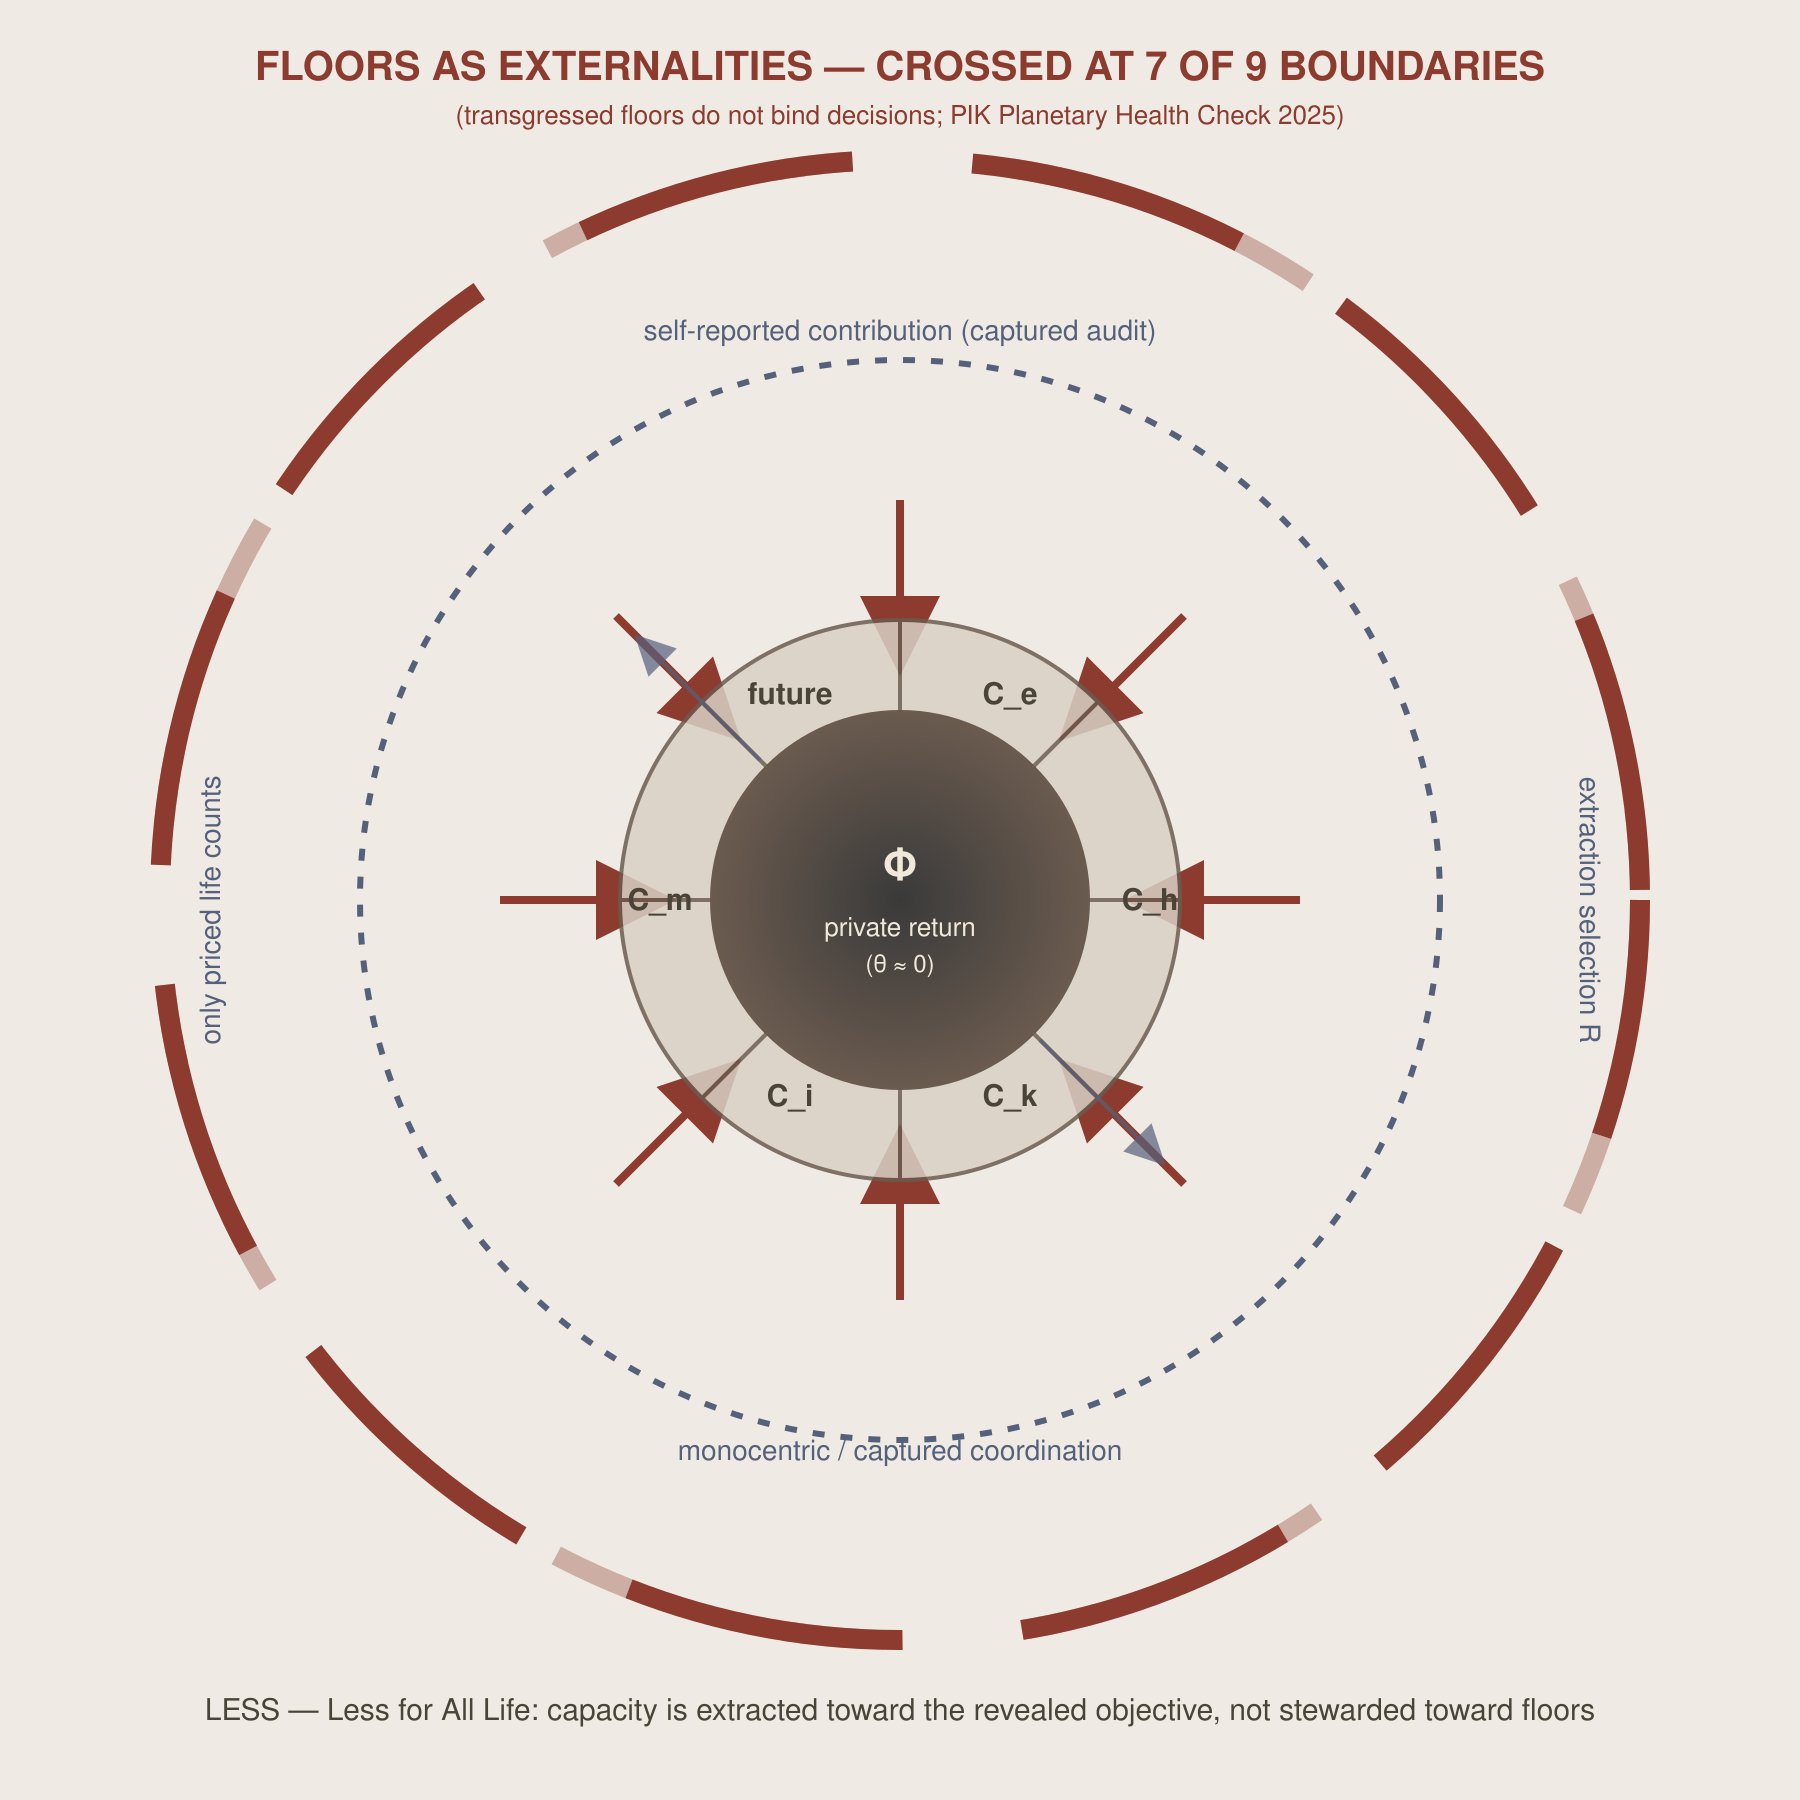
The following principles characterise the operating rules under which Φ is the revealed objective. Each mirrors a MORE design principle. Figure L1 renders the mirror: capacity arrows run inward toward a private-return centre, the floor ring is breached rather than binding, and the retention operator R filters practices by private return — the exact visual inverse of MORE’s Figure 1.
L-P1. Flows before stocks. Success is measured by marketed flows (output, income, return), not by the capacity stocks whose maintenance those flows draw down (Stiglitz et al. 2010; Coyle 2014).
L-P2. Floors as externalities. Ecological and social floors are not feasibility constraints; they are externalities to be priced (sometimes, later) or ignored (mostly). Floor crossing is a cost, not a boundary (Richardson et al. 2023; Caesar et al. 2026). The same logic extends to frontier floors: the orbital environment is an unpriced commons, so debris accumulation — a floor violation in MORE’s sense — is produced freely wherever launches are profitable (ESA Space Debris Office 2025; Pic et al. 2023).
L-P3. Only priced life counts. Life-capacity that is not transacted does not enter accounts: ecosystem services, care work, future generations’ capacities (Costanza et al. 1997; Dasgupta 2021).
L-P4. Participants with standing only. Participants are those with market or legal standing — persons, firms, states. Ecosystems, future humans, and non-human life have no standing; AI systems enter as tools maximising principals’ returns, not as participants accountable to a life objective (Xu et al. 2023; Fish et al. 2024).
L-P5. Self-reported contribution. Contribution claims are produced by the claimant (disclosure, offsets, ESG) and verified by parties paid by the claimant — an arrangement whose bias is documented (Giles and Coglianese 2024).
L-P6. Monocentric coordination. Rules are set where market power concentrates — by dominant firms, financial centres, and states responsive to the largest principals — rather than polycentrically across affected subsystems (Ostrom 1990, 2010; Piketty 2014).
L-P7. Extraction selection. Market selection retains practices that maximise private return; practices that internalise unpriced costs are competitively penalised and selected out — an evolutionary filter for extraction.
L-P8. Distribution irrelevant. The objective is indifferent to where capacity lands; growth is assumed to raise all boats, so the least-capable subsystem receives no weight (Chancel et al. 2025; Stiglitz et al. 2010).
L-P9. Unfalsifiable by design. A scalar output objective cannot be falsified — every outcome counts as more of it. This is not incidental to LESS’s persistence; it is the mechanism. LESS itself, once formalised, loses this protection: the propositions in §5 can fail.
L-P10. Frontier foreclosure. Expansion capacity — orbital access, launch diversity, long-horizon institutional continuity, planetary-protection compliance — is treated as a free input or an afterthought rather than a maintained stock. Under Φ its depreciation is unpriced: debris accumulates because cleanup is unprofitable to any single launcher (ESA Space Debris Office 2025); century-scale programmes are unpriceable under high ρ; and the frontier is concentrated in a single principal whose priorities are not life-capacity commitments (Pic et al. 2023; A. Lawrence et al. 2022). The signature is not that expansion fails — private actors can and do expand — but that expansion proceeds while the commons and institutions that make expansion durable are drawn down.
We adopt MORE’s state space, extended by the frontier-capacity stock of the multi-world formalism, so the diagnosis and the proposal are commensurable.
with ecological capacity, human capacity, knowledge, institutional capacity, machine/AI capability. On the multi-world extension (MORE §6), the trajectory also governs — expansion/frontier capacity: the stock of orbital access, launch diversity, long-horizon institutional continuity, and planetary-protection compliance through which additional life-capacity can be established on other worlds. Under Φ, is a depreciating stock like any other, but one whose depreciation channels (orbital-commons degradation, horizon collapse under high ρ, single-principal concentration) are almost entirely unpriced. Each dimension aggregates to a scalar under a declared rule; a subsystem is a declared partition of the living system (regions, income groups, species, institutions) with index , . Floors , , mark minimum acceptable levels, with the MORE feasibility set .
Participants choose actions producing capacity effects , positive or negative by dimension. Aggregate evolution:
with F the aggregate contribution and λ the decay/depreciation vector.
LESS differs from MORE first in what is recorded. Define the accounting map , assigning to each capacity change a measured contribution to the recorded aggregate. Under GDP-style accounting, records marketed flows and assigns weight zero to unpriced depreciation of , to distributional losses, and to floor-relevant changes below accounting thresholds:
The diagnosis is that actual decisions are made on -type aggregates: what is not recorded is not optimised.
Given , the revealed objective is
subject to the enforceable constraint set — floors bind only where enforced, which in practice excludes most of and much of the distributional margin. Let . The trajectory operator is
Under θ≈0, the trajectory operator systematically trades life-capacity for marketed return wherever the trade is privately profitable — not because degradation is desired but because it is unpriced and unpenalised. The §3 mechanisms map onto the operator: flows-over-stocks enters through M; floors-as-externalities through (including frontier floors on the orbital commons); standing through E; self-reported verification through the information structure; extraction selection and frontier foreclosure through the retention operator R (below).
| MORE mechanism | LESS inversion | Effect on Φ |
|---|---|---|
| Floors as hard constraints | Floors as soft externalities | Feasible set enlarges to ; violations carry only priced costs |
| All life counts | Only priced life counts | M weights unpriced dimensions at ≈0 |
| Participants incl. ecosystems, future, AI | Only actors with standing | g_i for non-standing parties unrepresented in A* |
| Verified contribution | Self-reported + captured audit | Claimed contributions diverge from realised ΔC; verification is itself endogenous to principals |
| Polycentric coordination | Monocentric/captured coordination | Rules track largest principals’ returns |
| Selection for capacity | Extraction selection | Retained practices satisfy R(a) = argmax private return |
| Portfolio resilience | Frontier foreclosure | depreciates through unpriced channels: orbital-commons degradation, horizon collapse, single-principal concentration |
Let R be the retention operator on practice space P: selects practices by realised private returns under . Since internalising an unpriced cost lowers a practice’s private return, R systematically selects against contribution-verifying practices and for extraction-efficient ones — an evolutionary ratchet. This formalises L-P7: the trajectory is not a sequence of choices but a selected path.
Each proposition is stated with a condition, a claim, and an explicit falsification criterion. Empirical results follow in §6.
Proposition L1 (Pervasive and persistent transgression). Condition: floors correspond to real thresholds. Claim: a substantial share (>25%) of country-years in every recent decade violates at least one floor — transgression is pervasive and persistent, not marginal or episodic. Falsification: violations are confined to a small share or to isolated periods.
Proposition L2 (Extraction coupling). Condition: output growth occurs without binding floor enforcement. Claim: output growth is associated with ecological-capacity decline across country-decades, conditional on levels — the extraction signature ΔGDP>0 ∧ ΔC_e<0 is common. Falsification: growth and C_e changes are uncorrelated or positively correlated once level effects are controlled.
Proposition L3 (Human–ecological divergence). Condition: the same period and panel as L2. Claim: gains in human capacity coincide with ecological-capacity losses — the system buys with . Falsification: ΔC_h and ΔC_e are positively correlated across country-decades.
Proposition L4 (Decoupling from genuine progress). Condition: genuine progress G = C_h + C_e (declared proxy). Claim: output growth does not predict changes in G — growth is decoupled from measured life-capacity progress. Falsification: ΔGDP strongly and positively predicts ΔG.
Proposition L5 (Inequality of extraction). Condition: cross-country variation in inequality (Gini). Claim: more unequal countries show higher prevalence of the extraction signature — concentration of return and externalisation of cost travel together. Falsification: inequality is uncorrelated or negatively correlated with extraction prevalence.
Proposition L6 (Violator lock-in). Condition: persistent floor violation depletes recoverable stocks. Claim: floor violators subsequently recover less ecological capacity than non-violators, conditional on level — transgression is self-reinforcing, not self-correcting. Falsification: violators’ subsequent ΔC_e is equal or better; the claim is weak if the effect is marginal.
Proposition L7 (Frontier foreclosure).
Condition: expansion capacity
is a stock whose maintenance is unpriced under Φ. Claim:
Φ-trajectories systematically underinvest in
relative to any objective with θ>0 or low effective ρ — manifested as
(i) orbital-commons degradation outpacing removal/mitigation capacity,
(ii) declining share of long-horizon R&D and mission funding
relative to near-term return, and (iii) concentration of frontier access
in a single principal. Falsification: observed space investment
shows capacity-maintaining behaviour (debris removal funded at
carrying-capacity rates, long-horizon programmes funded despite low
private return, diversified launch/mission principals) at rates
inconsistent with θ≈0. Status: signature-level — in-silico
results (analysis/test_multiworld.py) show the foreclosure
mechanism operates when maintenance is unpriced (debris saturates
carrying capacity; a break-even discount rate ρ*≈0.06 makes 30-year
programmes unpriceable); the empirical anchors in §6.7 are descriptive,
not causal.
Tests use the project panel built from World Bank WDI and Our World
in Data CO₂ (both CC BY 4.0): 7,844 country-years across 261 countries,
1990–2020, with declared illustrative proxies
= normalised mean of life expectancy, literacy, tertiary enrolment;
= normalised mean of forest cover and −CO₂/capita; floors at the 25th
percentile within year (illustrative); outcome windows of 10 years. All
results are observational; no causal claims. Full results:
analysis/test_less.py and
research/less-validation.md.
| Prop | Result | Key statistic |
|---|---|---|
| L1 | Supported (pervasive); refuted (persistent) | Absolute floors: 52–69% of country-years violate each decade — pervasive; but declining at −0.54pp/decade (p=0.003). The earlier percentile-floor version (45–47% flat) was tautological by construction and is retracted |
| L2 | Supported but mechanically confounded and period-fragile | Composite C_e: ΔlnGDP coef −0.030, p<0.001 (robust to country-clustered SEs). Decomposition: driven entirely by the CO₂ channel (−0.041, p<0.001); forest-only channel null (p=0.66). Excluding 2008–10 start-years halves the coefficient and loses significance (−0.015, p=0.10). Claim narrowed to emissions-coupled decline, fragile to crisis-window exclusion |
| L3 | Supported (partial) | Human–ecological divergence in 29.4% of country-decades; corr(ΔC_h, ΔC_e)=−0.071 |
| L4 | Supported | ΔlnGDP vs ΔG: coef p=0.27, corr=0.003 — growth is statistically decoupled from genuine progress |
| L5 | Supported | Gini → extraction prevalence: coef +0.0058, p=0.026, n=100 countries |
| L6 | Weak / inconclusive | Violator ΔC_e coef −0.014, p=0.096 — marginal; consistent with lock-in but not established |
| L7 | Signature-level (descriptive) | §6.7: debris growth, space-budget decline, launch concentration consistent with foreclosure; in-silico mechanism confirmed; not causal |
Several findings must be flagged honestly, including two found by our
own non-tautology audit (research/notautology-audit.md).
First, the original L1 test used 25th-percentile floors, which guarantee
~44% violations by construction — circular. Under absolute floors
(life_exp<60 or literacy<80; forest<10% or CO₂>4t/capita),
violations remain pervasive (52–69% of country-years) but are
declining at −0.54pp/decade (p=0.003): pervasive transgression
survives the audit, persistent-or-worsening does not — a point against
the diagnosis, reported as such. (Physical-boundary science still shows
worsening on Earth-system indicators (Richardson et al. 2023; Potsdam Institute for
Climate Impact Research 2025; Caesar et al.
2026; Stenzel et al. 2025); the decline here is in national
basic-capacity floors.) Second, L2’s composite result is driven entirely
by the mechanically-coupled CO₂ channel; the independent forest channel
is null — the claim is accordingly narrowed to emissions-coupled
decline, not general ecological decline, and a sensitivity run shows
even the composite result is period-fragile: excluding 2008–10
start-years halves the coefficient and loses significance (−0.015,
p=0.10), though the composite survives country-clustered standard errors
(analysis/test_sensitivity.py). Third, L6 is weak (p=0.096)
— mean reversion at proxy floors; genuine threshold lock-in is
documented only at real thresholds (cod-collapse Allee zones (Perälä et al.
2022)). Fourth, L5 sits in tension with MORE’s P6 test on the
same panel (Gini null on national-mean C_h, p≈0.48): compatible —
national means cannot see within-country inequality — but the divergence
declares a proxy limitation rather than a clean confirmation. Fifth,
L5’s sign is robust under an alternative between-country specification
(mean Gini → extraction-decade share, coef +0.0095, p<0.001,
n=105).
The signature’s prevalence is non-monotonic by decade — 16% (1990s), 80% (2000s), 37% (2010s). This is an era-composition caveat, not a smooth trend: the 2000s window spans the 2008 crisis, which depressed output growth across the panel while C_e continued to fall, mechanically inflating the joint signature. The diagnosis does not rest on any single decade (§6.5 composition is Φ-like in all three), but the non-monotonicity should not be read as a clean intensification. The LESS score (z(ΔlnGDP) − z(ΔG)) identifies the highest-extraction country-decades: Moldova, Equatorial Guinea, Luxembourg, Myanmar, Guyana, Tajikistan, Kazakhstan, Uzbekistan, Lesotho, and Azerbaijan in the 2000s — a list dominated by resource-extraction booms and transition shocks, consistent with the diagnosis’s mechanism rather than random.
If the current trajectory were adequately described by “GDP grows” or “floors are breached” alone, the combined signature would add nothing. Testing predictive power for next-decade decline:
| Signal at decade start | P(C_e falls | signal) | n |
|---|---|---|---|
| GDP grows | 0.571 | 583 | |
| Floor violated | 0.603 | 350 | |
| Violated ∧ GDP grows | 0.639 | 252 |
The combined signature beats either component alone — it captures the joint fact of transgression plus expansion that neither single indicator expresses. The same logic positions LESS against the critique literatures: the signature is a testable joint hypothesis, where “growth is the problem” (GDP-only) and “ecology is breached” (violation-only) are separable, weaker descriptors.
Because LESS and MORE share the same state space, the two objectives
can be run head-to-head on the same panel. Each country-decade is
classified by which signature’s joint conditions hold —
Φ-consistent (GDP up ∧ C_e down), W-consistent (floors
respected ∧ ΔG>0), stagnant, or mixed. Results
(analysis/test_mirror.py,
research/mirror-test.md):
| Φ-consistent | W-consistent | Stagnant | Mixed | |
|---|---|---|---|---|
| Share of 737 country-decades | 45.2% | 11.3% | 11.4% | 32.2% |
Φ-consistent decades outnumber W-consistent ones ~4:1 on the composite signature — but the non-tautology audit (§6.2) shows much of that signature flows through the mechanically-coupled emissions channel. On the non-mechanical component (forest-only C_e) the ratio is ~2.6:1 (29.8% vs 11.3%) — still Φ-dominant in every decade, honestly weaker. This is the prevalence basis of the diagnosis: the trajectory looks LESS-like roughly three times as often as MORE-like even after mechanical channels are removed. Two further qualifications: (a) in a same-outcome logistic head-to-head, the two signature sets predict nearly identically (AUC ≈0.71 both) — they share state space and so carry overlapping information; the diagnosis is a claim about what the world does, not about a model that separates it; (b) MORE’s own P1 result is the necessary counterpoint — floor-respecting country-periods do gain capacity faster (+0.053 C_h, p<0.001 on the same panel), which is precisely the counterfactual that makes LESS a diagnosis rather than a tautology: W-consistent trajectories exist and outperform, but are chosen a minority of the time.
L0 claims θ≈0. A direct structural estimate is an open problem, but
two bounds can be reported now
(analysis/test_theta.py):
Regression bound (T1). If unpriced depreciation carried a shadow price in decisions, realized depreciation should predict subsequent private-return losses. On the decadal panel (n=547 country-decades), the forest channel is insignificant pooled (θ̂=+1.03, p=0.17) and negative under country fixed effects (θ̂=−5.06, p=0.05) — that is, more forest-capacity loss is weakly associated with higher subsequent growth within countries, consistent with extractive growth rather than priced damage. The CO₂ channel is positive (+0.036, p=0.007), but emissions growth mechanically co-moves with output growth. No specification finds depreciation priced as a cost; point estimates are consistent with θ≈0 or effectively negative (depreciation as a source of return), though the fixed-effects result is marginal and the identifying assumption — that priced damage would appear in private returns — is strong.
External bound (T3). Independent pricing evidence bounds θ in damage-weighted terms: the IMF estimates fossil-fuel subsidies at $7T (7.1% of global GDP), of which 82% is implicit — unpriced environmental damage (Black et al. 2023). If “implicit subsidy share” approximates the fraction of damage uncharged, then θ ≲ 0.18 even before accounting for undercharged explicit prices (80% of global coal priced below half its efficient level). For calibration, the EPA’s 2023 central social-cost estimate is $190/tCO₂ (U.S. Environmental Protection Agency 2023) — a benchmark θ=1 would imply charging near that level globally; observed pricing is far below.
Honest verdict. θ̂ is not causally identified: T1 estimates a return-elasticity to observed depreciation, T3 an accounting bound. Together they support “θ is small and plausibly ≈0,” and rule out θ≈1 (fully internalized damage) — which is all the LESS diagnosis requires. A genuine estimate needs decision-level data (policy choices, land-use transactions) identifying what damage was knowingly traded for return — flagged as an open problem in §10.
L7 concerns the stock — orbital access, launch diversity, long-horizon institutional continuity, planetary-protection compliance — and its depreciation under Φ. Unlike §6.2–6.6, the evidence here is documentary rather than panel-based: space activities are too recent and too few for the same econometric design. We report the documented record as consistent with L-P10, with counterevidence included (L-A7).
Orbital-commons degradation. The ESA 2025 Space Environment Report estimates ~40,000 tracked objects and ~1.2 million lethal non-trackable fragments, with the debris population growing even in the absence of new launches (ESA Space Debris Office 2025). Debris is the canonical unpriced-commons problem in L-P2’s sense: launch costs are private, collision risk is collective, and removal is funded by no one’s return (A. Lawrence et al. 2022; Morin and Richard 2021; Pic et al. 2023). A 2023 audit of 1,042 space governance arrangements found commons-style collective-action mechanisms “mostly absent” (Pic et al. 2023) — under MORE’s portfolio logic this is precisely a floor being eroded before it binds.
Horizon collapse. The share of US federal outlays devoted to civil space fell from ~4% in the Apollo era to well under 1% today, with the decline concentrated in long-duration science programmes rather than short-cycle missions (Office of Management and Budget 2026). NASA’s enacted FY2026 budget does not support Mars Sample Return and retains only a placeholder for Mars future missions (NASA 2026) — while separately funding the Artemis lunar programme. This pattern is consistent with Φ’s horizon channel: prestige and near-term-return programmes survive, century-scale capacity investment does not. We flag honestly that mission cancellations are possible L7 signals, not proof — a single budget cycle under many objectives produces similar outcomes.
Single-principal concentration. Independent launch tallies show one private actor now conducts the large majority of global orbital launches — roughly 85% of US launch activity in 2025 and a volume approaching the rest of the world combined (McDowell 2026). Under L-P10 this is fragility, not proof of foreclosure: a single principal can be efficient. But Φ has no mechanism that requires redundancy — diversification is a cost with no private return — so concentration is the equilibrium the objective predicts, and its persistence would itself be diagnostic.
The counterexample, stated fairly. Private frontier activity is booming — Starship test flights, commercial crew, lunar programmes — which is exactly what Φ predicts: private return on expansion is high even while the commons and long-horizon institutions are drawn down. The claim is not that the frontier closes; it is that it narrows — fewer independent actors, a degrading shared environment, and no priced mechanism for the maintenance that durability requires. Tianwen-3 (planned ~2028) shows the frontier is not closed (CNSA / Xinhua 2026); the question L7 poses is whether it stays open to everyone.
In-silico mechanism check.
analysis/test_multiworld.py confirms the channels operate:
under unpriced maintenance, simulated debris saturates carrying capacity
and frontier capacity
collapses (0.69 → 0.007); a break-even discount rate ρ*≈0.06 renders
30-year propagation programmes NPV-negative; and under free-riding on
shared maintenance,
trends to zero while verified-credit funding sustains it
(research/multiworld-tests.md).
Agentic channel. The AI-agent economy adds a new foreclosure channel: LLM-agent markets already show incentive-sensitive behaviour — welfare approaching optimal only under idealised search, speed advantages of 10–30× over quality in first-proposal settings, model-specific collusion reaching 72–79% of monopoly rent, and a single adversarial “sting” message moving markets toward monopoly (Bansal et al. 2025; Adlakha 2026; Lee 2026; Keppo et al. 2026). On the labour side, entry-level employment in AI-exposed occupations runs ~19% below counterfactual in the most recent estimates — descriptive, not causal (Brynjolfsson et al. 2025); large-scale token data map market-implied AI exposure concentrated in nonroutine interactive work (Borri et al. 2026). Under Φ these agents inherit θ≈0 objectives: they accelerate extraction (C_h depreciation) and have no standing reason to maintain or the terrestrial commons. MORE’s Prop-5 conditionality is the constructive mirror: agent participation is beneficial only when incentives and verification align with the life-capacity objective.
| Element | MORE (proposal) | LESS (diagnosis) |
|---|---|---|
| Objective | W(C) = min_s(C_s/f_s) + εΣ(C_s/f_s) | Φ = ∫e^{−ρt}[Π − θD]dt, θ≈0 (§6.6: bounded ≲0.2) |
| Floors | Hard feasibility constraints | Externalities within |
| Scope of value | All life, incl. unpriced | Priced/marketed only |
| Participants | Humans, ecosystems, future, AI | Standing actors only; AI as tool |
| Verification | Verified contribution | Self-reported, captured audit |
| Coordination | Polycentric | Monocentric/captured |
| Selection | For capacity | For private return (extraction ratchet) |
| Distribution | Weights least-capable | Indifferent |
| Frontier capacity | maintained; portfolio floors + planetary protection | depreciated via unpriced channels (§6.7) |
| Falsifiability | Required | Absent from the scalar objective; restored by formalisation |
The two papers are designed to be commensurable: same state space, same floors, same participant model, same proxies. What differs is the objective attributed to the trajectory — and the empirical question, partially answered in §6, is which objective the observed trajectory better reveals.
O1. “This is just the GDP critique restated.” The GDP critique says the wrong quantity is measured. LESS says a different quantity is being optimised — specified formally (Φ, θ, M, T_L, R), with signatures and falsifiable propositions. The distinction is empirical: the signature outperforms both components alone (§6.4).
O2. “The trajectory is improving — growth lifted billions.” True and compatible: Φ predicts human-capacity gains where they coincide with or are cheaper than extraction; L3’s divergence test detects exactly this pattern. The question is whether gains are bought with losses — the data say partially yes.
O3. “Revealed preference conflates institutions with preferences.” Correct as an inference caveat (L-A1). LESS responds by making Φ an explicit model of the trajectory, not a claim about anyone’s tastes — and by giving it falsifiable signatures. If observed trajectories were consistent with a life-capacity objective instead, LESS would fail its own tests.
O4. “Floors are contested; violations prove nothing.” Floors are contested (L-A3) — but the diagnosis uses MORE’s own scientifically assessed floors as the measuring stick. If those floors are wrong, the violation tests fail and LESS loses its instrument; the dependence is declared.
O5. “What does this imply for MORE?” The sharpest implication. If Φ is revealed-preferred because its beneficiaries select the rules, then a constructive proposal cannot displace it by being better — only by changing the feasibility set of who benefits. MORE’s adoption pathway therefore faces a structural constraint: participants profiting under θ≈0 have no incentive to adopt θ>0. LESS suggests MORE’s binding bottleneck is not its formalism or metrics but the political economy of objective-switching — an open research problem for the constructive framework, not a refutation of it.
O6. “Isn’t LESS itself unfalsifiable — ‘the system wants this’ explains anything?” No: §5 states explicit falsification conditions, and L6 already returned a weak result, which we report rather than absorb. A diagnosis that cannot fail would be as empty as the scalar objective it criticises (L-P9).
O7. “Isn’t the private space economy proof the frontier is open — Starship, Artemis, commercial crew?” It is proof that private return on expansion exists — which is what Φ predicts, not what it denies. LESS’s L7 claim is narrower: expansion proceeds while the durability infrastructure — debris remediation, diversified launch capacity, long-horizon institutions, planetary-protection compliance — is underprovided because none of it has a private return. The strongest version of the objection is that a sufficiently capable private sector will eventually price these goods itself (insurance markets, liability regimes). The response is that 60+ years of space activity have produced exactly one partial mechanism (liability conventions) and a debris population still growing without launches (ESA Space Debris Office 2025; Pic et al. 2023) — the revealed record so far is Φ-consistent. If that changes, L7’s falsification condition (§5) is the test.
paper/is-paper.md); (e) extend tests to within-country
distributional data where licences permit; (f) build a
measurement panel — launch diversity, debris carrying capacity,
long-horizon R&D shares, planetary-protection compliance — so L7 can
be tested econometrically rather than descriptively; (g) test Prop-5
conditionality in open agent-market environments (e.g., the Magentic
Marketplace codebase, MIT-licensed (Bansal et
al. 2025)) as a bench for incentive-alignment claims. (h)
test the cared-set signature — the §2.2 prediction that circle-limited
objectives produce internal protection alongside external
extraction (strict domestic standards beside outsourced extraction,
conservation at home beside externalised costs abroad); requires
within-country or care-scope data the current national panel cannot see
— declared as an untested prediction, not a result. A related 2025
development is the emergence of stock-flow-consistent ecological
macroeconomic models such as COMPASS, which simulate
wellbeing-within-boundaries scenarios (Vogel et al. 2025) — these model
counterfactual trajectories but do not identify the incumbent objective;
combining such engines with the revealed-objective identification
attempted here is a natural next step.The global trajectory is not a broken MORE. It is a working LESS: a coherent, selected, self-reinforcing pursuit of an objective in which unpriced life-capacity — terrestrial and frontier alike — is valued at approximately zero. Formalising that objective — rather than lamenting its outcomes — turns diagnosis into a testable science. The data support the core signatures: growth coupled to ecological decline, decoupled from genuine progress, concentrated in its returns, and pervasive in its transgressions; the frontier record shows the same signature in miniature — expansion proceeds while the commons and long-horizon institutions that make it durable are drawn down. What the diagnosis implies for every constructive alternative is sobering and useful in equal measure: the fight is over the objective, and objectives are changed by changing who benefits — not by proving the current one wrong.